
For Immediate Release: May 1, 2023
Phone: 406-252-2516; r-calfusa@r-calfusa.com
Below please find an op-ed by R-CALF USA CEO Bill Bullard regarding the Nevil Speer Opinion: Speer: The OFF Boondoggle, published April 19, 2023, in Drovers.
Baffling Argument by an OFF Act Opponent
Op-ed by Bill Bullard, CEO, R-CALF USA
In his April 19, 2023, Opinion, “Speer: The OFF Boondoggle” published in Drovers, Nevil Speer makes the spurious argument that the beef consumption data reported by the U.S. Department of Agriculture (USDA) cannot be used by OFF Act (Opportunities for Fairness in Farming) supporters to demonstrate the ineffectiveness of the beef checkoff program. If Speer is correct, then, conversely, it must also be true that beef consumption data cannot be used by OFF Act opponents to demonstrate the effectiveness of the beef checkoff program, or even for determining changes in eating patterns.
Apparently, Speer, a consultant, forgot to share his memo about the inappropriateness of using consumption data to determine the effectiveness of the beef checkoff program with economist Dr. Harry M. Kaiser of Cornell University, whom the Cattlemen’s Beef Board (CBB) of the beef checkoff program contracts with to determine the beef checkoff program’s return on investment.
Kaiser clearly defines his objective in his beef checkoff program’s return on investment study:
“To measure whether the CBB promotion, educational, and research activities increased consumption of beef products in the United States and foreign markets compared to what would have occurred in the absence of these activities” (emphasis added).
Likewise, Speer apparently did not share his memo with the economists at the USDA Economic Research Service (ERS) who also use beef consumption data as a proxy for determining shifts in eating patterns and food demand.
“ERS’s Food Availability data” provides “per capita estimates of the types and amounts of food available to U.S. consumers over time and identifying shifts in eating patterns and food demand.”
The ERS states that in 2021, 56.2 pounds of beef were available for human consumption in the U.S. and the availability of chicken surpassed beef in 2010 “to become the meat most available for U.S. consumption.”
Now wait a minute. Isn’t that precisely the argument made by the pro-OFF Act groups that Speer so desperately tries to discredit? Of course it is. Here is what Speer said the OFF Act supporters said that he found so objectionable:
“…beef was consumed at an average of 84.4 pounds per person per year in 1970, and in 2023, that number is expected to be 56.7 pounds per person. In contrast, chicken consumption is up from 40.1 pounds in 1970 to an estimated 101.9 pounds projected for 2023 — all without the help of USDA commodity checkoff programs —…”
In other words, the pro-OFF Act groups said that per-capita consumption data shows beef consumption declined under the beef checkoff program while per-capita chicken consumption data shows chicken consumption increased significantly during the same period without a chicken checkoff program.
In an attempt to present his counter argument, Speer creates a convoluted chart in which historical demand data are not presented on a historical time continuum; but rather, the data are presented in an overly complicated and purposefully fragmented and confusing way.
R-CALF USA sought out historical data for beef and chicken demand to see if common folks not steeped in or familiar with Speer’s consulting jargon can nevertheless determine if they are being baffled by an expert.
The two Kansas State University charts copied below illustrate what the pro-OFF Act groups have said all along – that beef has not fared well under the beef checkoff program while chicken has fared extremely well during the same period without a chicken checkoff program. But don’t take my word for it, see for yourself:
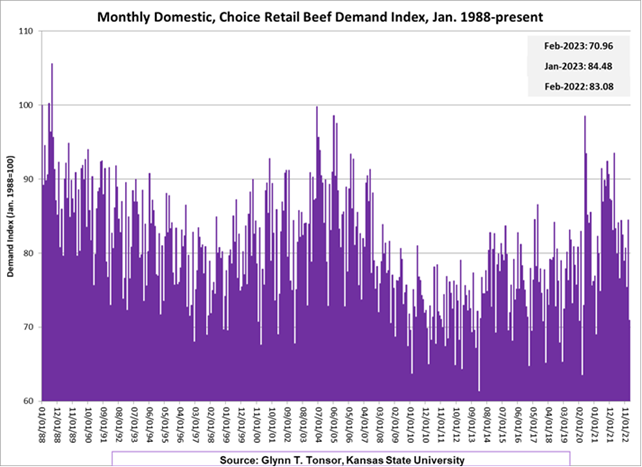
The beef demand chart above shows the historical volatility in beef demand during the period of the beef checkoff program.
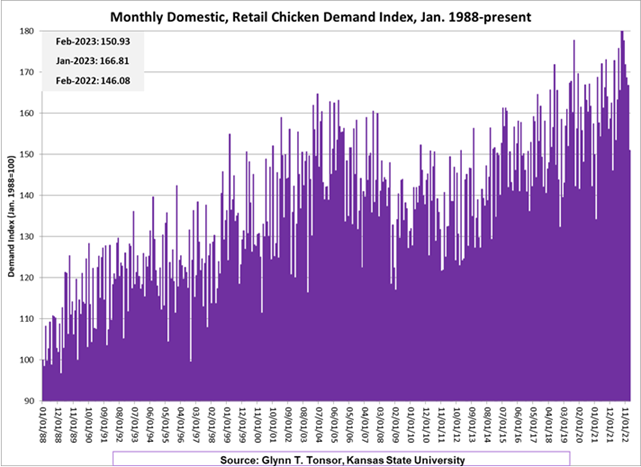
The chicken demand chart above shows the historical and nearly constant growth in chicken demand during the period of the beef checkoff program.
Unsurprisingly, the two KSU demand charts above track closely with the per-capita consumption data reported by the USDA-ERS below (note that the 1980-2020 period begins to the right of the chart’s center):
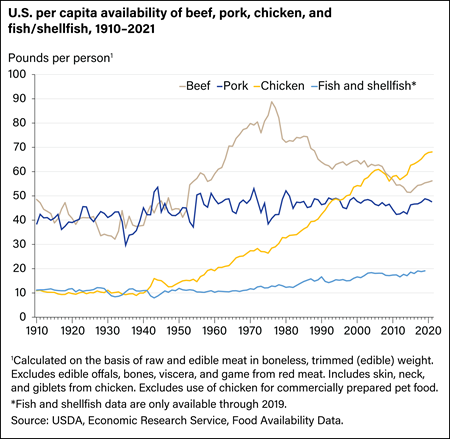
Hmm. So, despite Speer’s baffling argument, there is, after all, a correlatable relationship between consumption data and demand data.
**Note to editors: This column first appeared on Drovers.com April 28, 2023.
Bill Bullard is the CEO of R-CALF USA, the nation’s largest non-profit trade association exclusively representing the U.S. cattle industry.