Op-ed by Bill Bullard, CEO, R-CALF USA
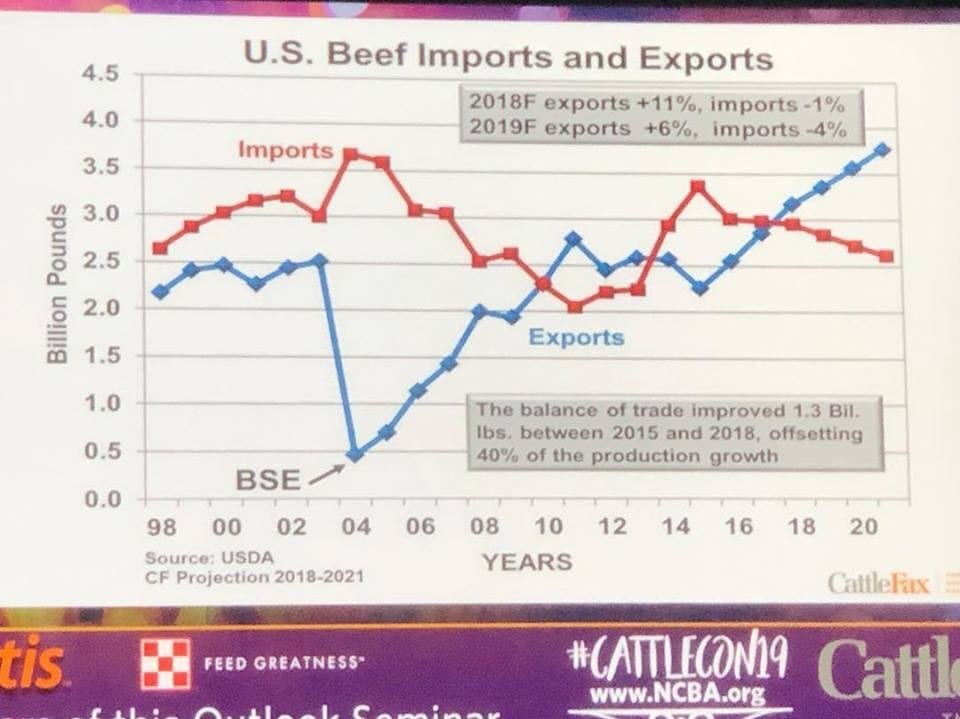
At the ongoing National Cattlemen’s Beef Association (NCBA) Cattle Industry Convention & Trade Show in New Orleans, CattleFax presented charts purporting to describe the state of the U.S. cattle and beef industries. One chart in particular depicts the U.S. balance of trade for beef, which shows the U.S. had a beef trade surplus during 2010 through 2012 and, beginning in 2017, another trade surplus was realized and CattleFax projects that surplus to both grow and continue through 2020.
This has to be wonderful news to U.S. cattle producers who know that if the U.S. sells more beef than it buys, the economic strength of the U.S. cattle industry will improve.
CattleFax Trade Chart
However, R-CALF USA’s chart depicting the balance of U.S. beef trade tells a very different story. It shows the U.S. has maintained a trade deficit every year since 1998 and that the deficit was over 1.2 billion pounds in 2017. This would indicate the U.S. cattle industry is being forced to absorb other countries’ overproduction and overcapacity.
R-CALF USA Trade Chart
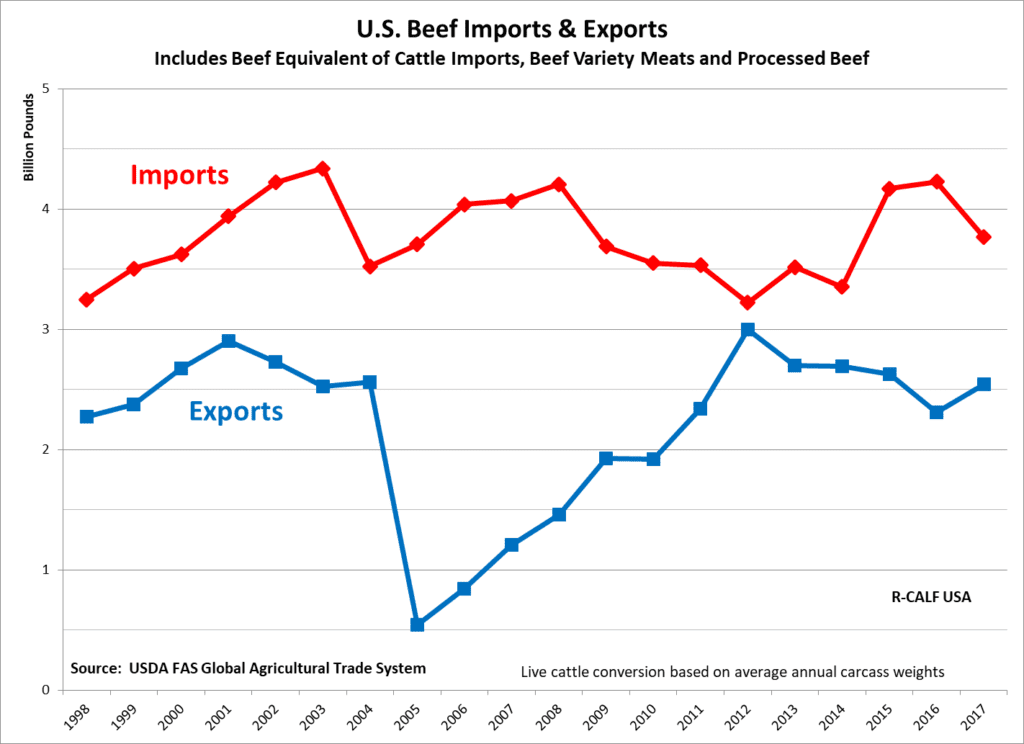
The difference between the two charts is profound. This is because the CattleFax chart is geared toward meatpackers who consider all the beef derived from imported cattle to be U.S. beef. R-CALF USA’s chart, on the other hand, is geared toward independent cattle producers who realize that the U.S. imports beef in two distinct forms: 1) the U.S. imports beef in packages; and, 2) the U.S. imports beef on the hoof in the form of live cattle.
R-CALF USA’s chart includes all beef imports, both packaged and on-the-hoof and converts the on-the-hoof beef into a beef equivalent by multiplying the number of imported cattle by the average carcass weight reported by U.S. meatpackers each year.
For example, in 2017 the U.S. imported over 1.8 million cattle, which represents the beef equivalent of about 1.4 billion pounds of beef.
By omitting the significant impact of imports of beef-on-the-hoof, CattleFax satisfies the packers’ strategy of convincing independent cattle producers to support the economic interests of the packers. They are able to convince producers to discount the adverse effects of imports and to support the packers’ efforts to continue focusing only on exports. Admittingly, that is good for packers and is helping them earn record margins while domestic cattle prices remain depressed.
Even the U.S. Department of Agriculture (USDA), which has historically favored the packers’ economic interests over the interests of independent producers, acknowledged in a 2012 study that “beef produced from foreign-born cattle accounted for 8.1 percent of monthly U.S. beef production.” See https://file.scirp.org/pdf/AS20120200006_23587394.pdf. The USDA also stated that unless this production from imported cattle is accounted for, “this production from imported livestock clouds what can be said about changes in U.S. technical efficiency in beef production.” See https://www.farms.com/news/imported_livestock_contribute-49580.aspx.
So, why does the CattleFax trade chart differ from the R-CALF USA trade chart? The answer is simple: The beef industry knows it cannot continue controlling U.S. cattle producers and their markets if cattle producers know the truth.
Bill Bullard is the CEO of R-CALF USA, the nation’s largest non-profit trade association exclusively representing the U.S. cattle industry.